1.0 What is a Customer Report? #
- A Customer Report provides valuable insights into customer activity, helping businesses track sign-ups, login frequency, transaction history, and demographics.
- It uses visual charts and graphs to display trends, making the data easy to interpret.
The report also helps monitor customer engagement, identify behavioral patterns, and optimize marketing strategies to better meet customer needs.
2.0 How To Access The Customer Report #
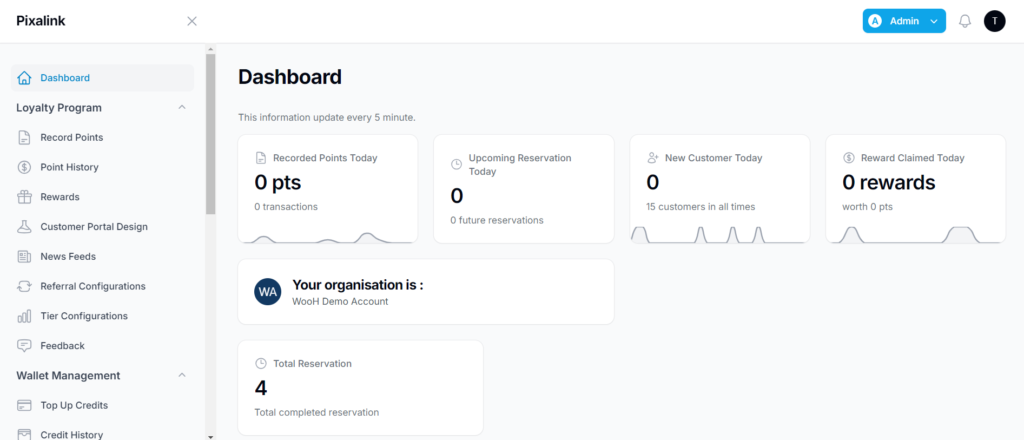
Step 1: Log in to your account. Once logged in, you will land on the home screen. #
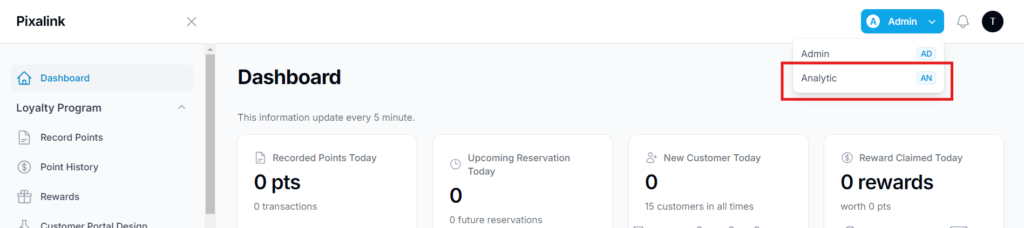
Step 2: Click the Admin button (blue box) in the top right corner. #
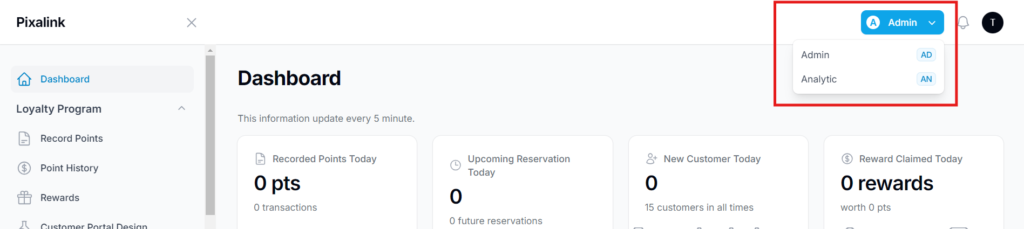
Step 3: Select the Analytic / AN features. #
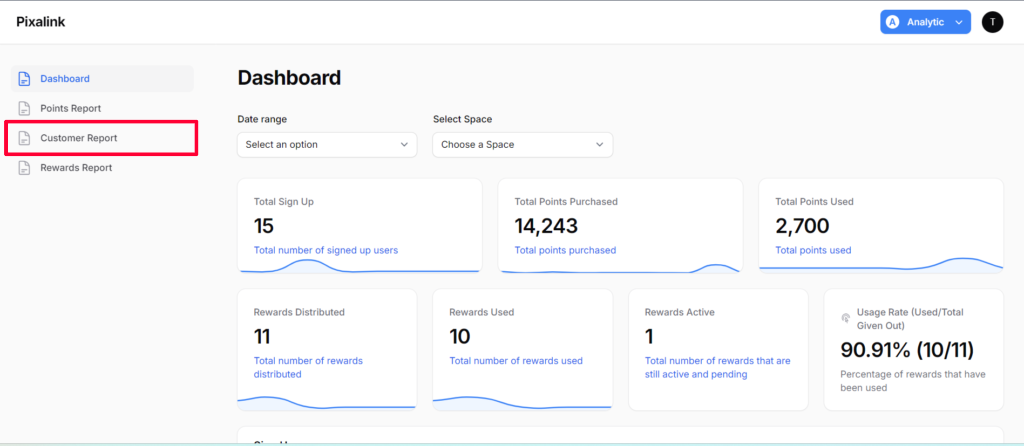
Step 4: Select Customer Report to view the data #

3.0 The Customer Report features #
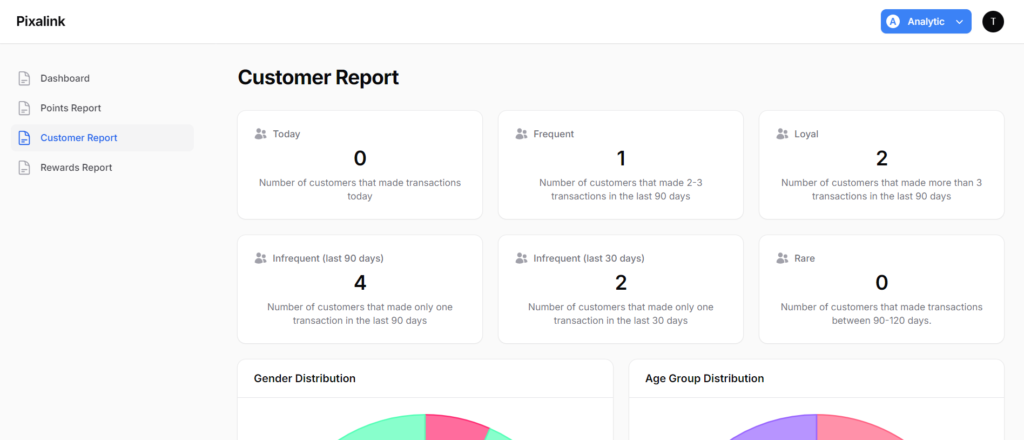
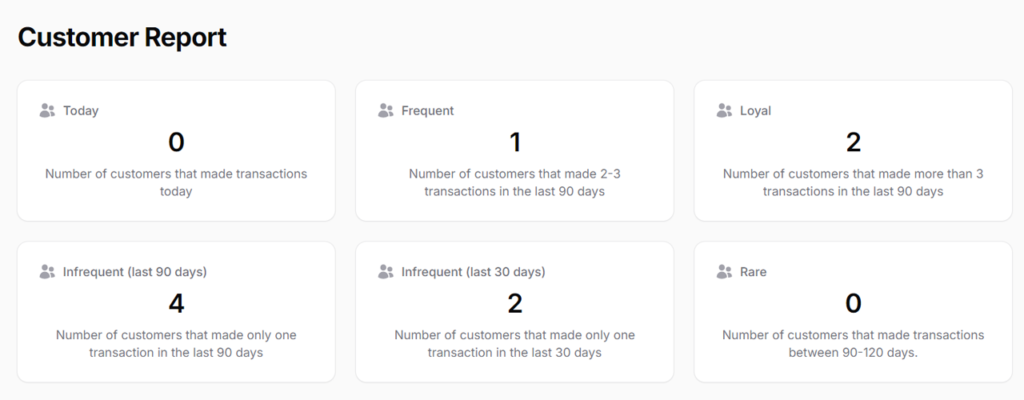
Customer engagement insights (top section): #
- Tracks customer transaction frequency over different time frames to help you assess engagement levels.
- It categorizes customers into segments such as Frequent (2–3 transactions in 90 days), Loyal (more than 3 transactions), and Infrequent (only one transaction in 30 or 90 days).
- It also highlights daily transactions and identifies rare customers (90–120 days since their last purchase).
4.0 Gender distribution & age group distribution (pie chart): #
Shows the breakdown of customers by gender and age groups. This helps you understand your customer demographics at a glance and tailor your marketing strategies accordingly.
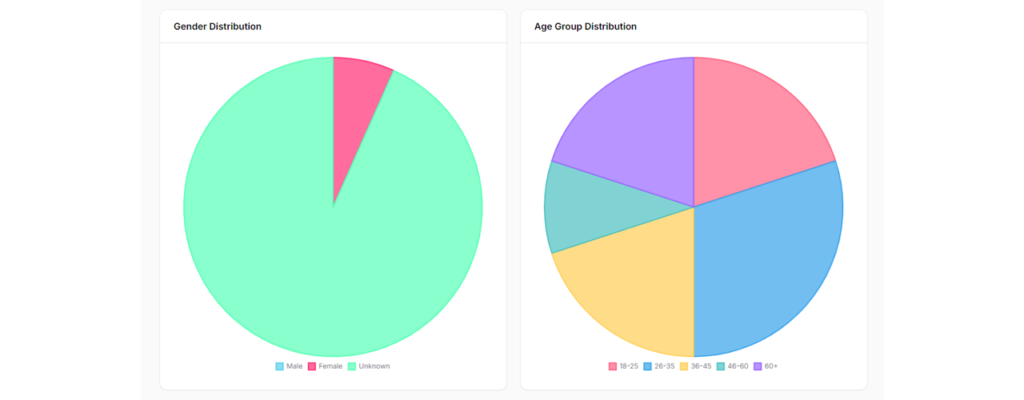
- Gender distribution: Provides a visual breakdown of customers by gender.
- Age group distribution: Segments customers into different age groups, offering insights into the dominant age demographics.
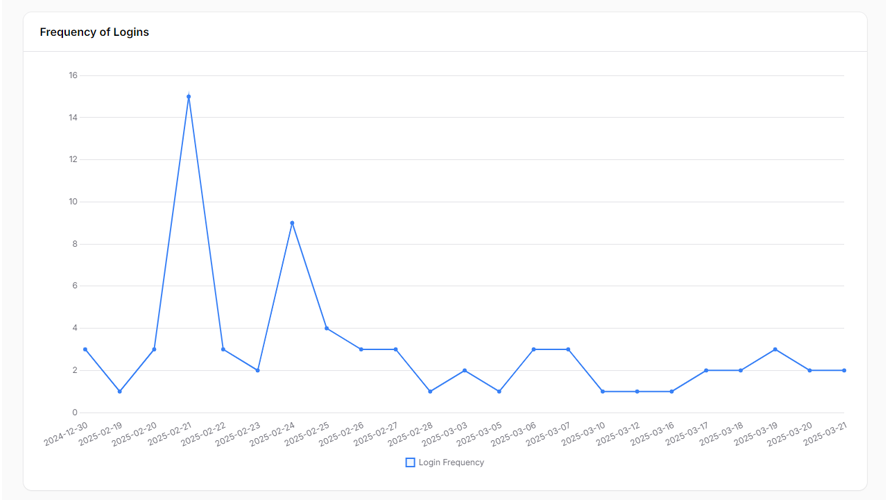
5.0 Frequency of Logins (Line Chart) #
Displays the number of customer logins over time, providing insights into user activity and engagement patterns.
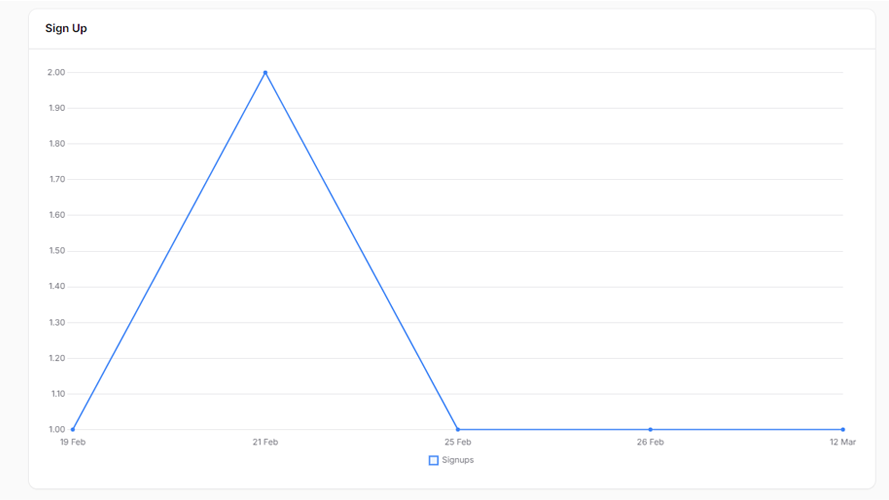
6.0 Sign-up trend (line chart): #
Visualizes the number of user sign-ups over time, highlighting spikes, trends, and growth patterns.